Document Properties
The PWA can be monitored using Prometheus.
Activating the feature Prometheus for the nginx or SSR container exposes metrics on port 9113 on the /metrics URL.
The SSR container also offers the configuration parameter METRICS_DETAIL_LEVEL to control the granularity of collected metrics:
Value DEFAULT:
- SSR metrics are collected globally, only labeled with HTTP method + response code (not split by URL / process)
- REST client metrics (ICM requests) are disabled
Value DETAILED:
- SSR metrics are split by http method, path, response status code, pm2_id (process id) and theme
- REST client metrics (ICM requests) are enabled
After activating the features on both containers, add tasks to prometheus:
scrape_configs:
  - job_name: 'pwa-nginx'
    scrape_interval: 5s
    dns_sd_configs:
      - names:
          - 'tasks.pwa-nginx'
        type: 'A'
        port: 9113

  - job_name: 'pwa-ssr'
    scrape_interval: 5s
    dns_sd_configs:
      - names:
          - 'tasks.pwa-ssr'
        type: 'A'
        port: 9113
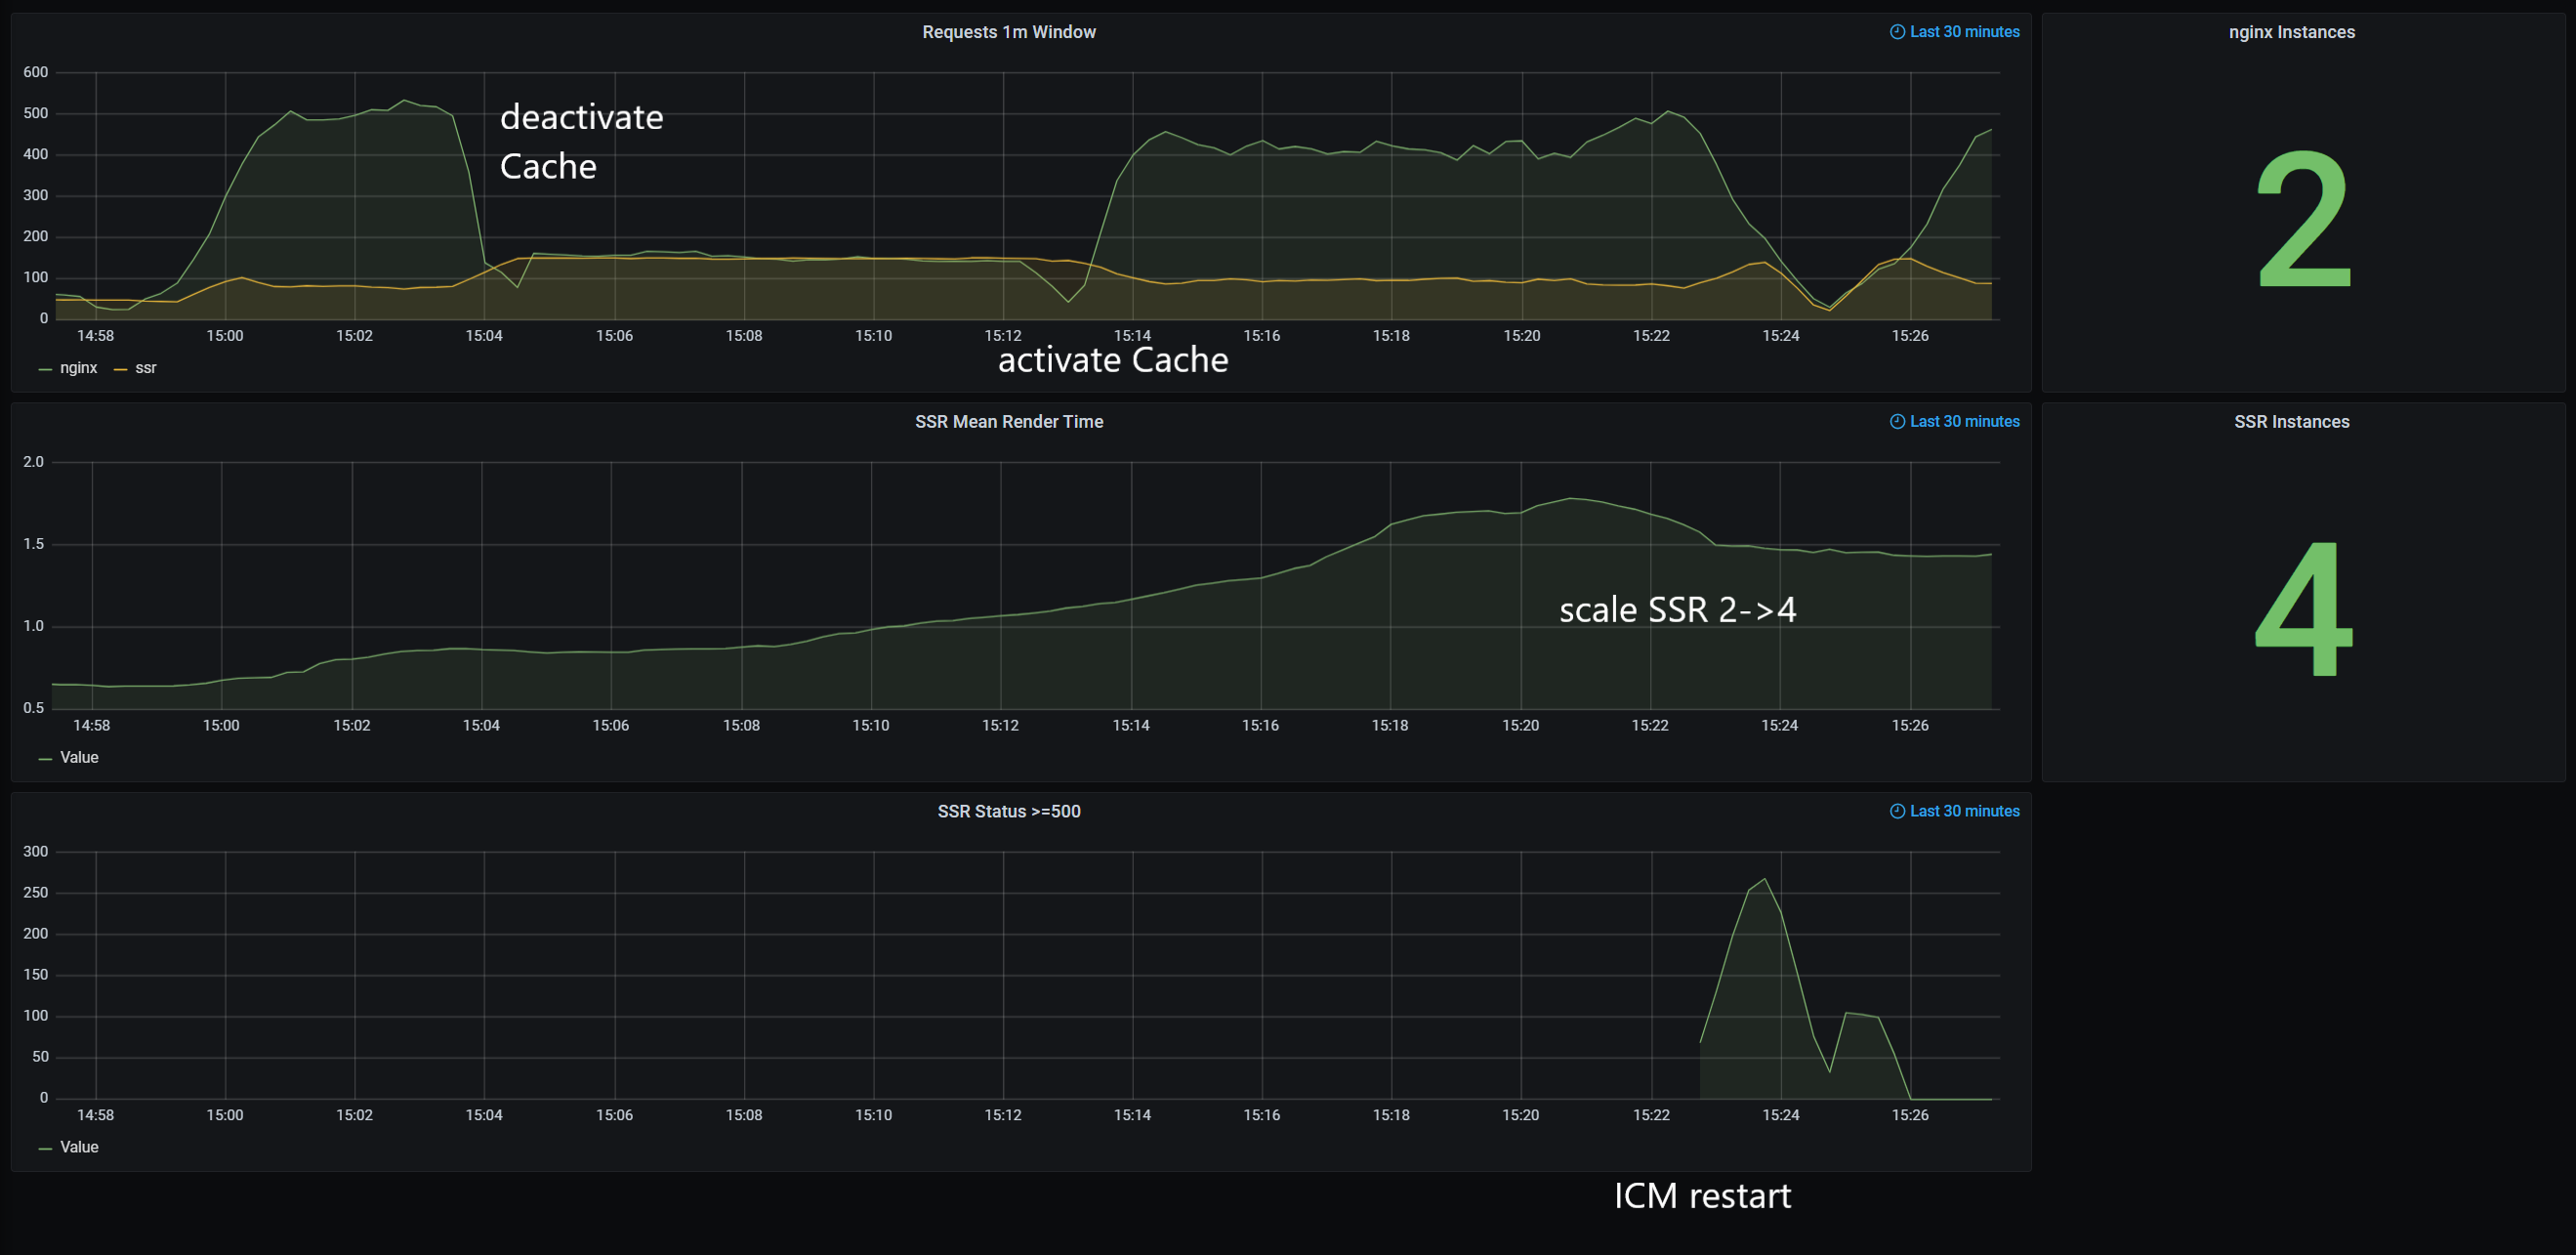
To get started, you can import our example Grafana Dashboard:
Note
The example dashboard is supposed to be used with METRICS_DETAIL_LEVEL=DETAILED only.
Warning
We recommend to switch off the SSR container health-check and define alerts in Grafana instead.
Further References
Disclaimer
The information provided in the Knowledge Base may not be applicable to all systems and situations. Intershop Communications will not be liable to any party for any direct or indirect damages resulting from the use of the Customer Support section of the Intershop Corporate Website, including, without limitation, any lost profits, business interruption, loss of programs or other data on your information handling system.

